
Accounting Program BS
Acquire a strong foundation in the topics required to qualify for the CPA Exam, encompassing both accounting and general business courses.
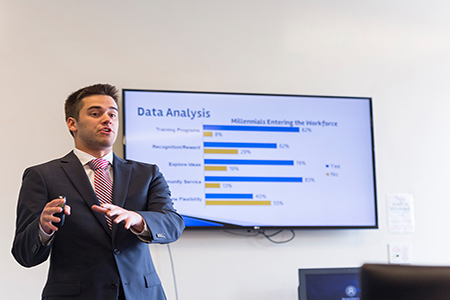
Business Management Program BS

Develop the authoritative perspective and personal leadership skills to manage effectively in a business environment of increasing complexity.
Business Management Program BS
Develop the authoritative perspective and personal leadership skills to manage effectively in a business environment of increasing complexity.
Entrepreneurship Program BS

Master the challenges of creating new business models, either through your own start-up businesses or innovating in the corporate world.
Finance Program BS

Gain a broad understanding of financial markets and the tools financial managers use in corporate and international finance.
International Business Program BS

Examine the complex challenges that face managers when organizations and products cross national borders.
Marketing Program BS

Develop skills to incorporate elements of data analysis, strategy, and creativity to help organizations market products, services, or ideas.
Marketing Program BS
Develop skills to incorporate elements of data analysis, strategy, and creativity to help organizations market products, services, or ideas.
Applied Mathematics Program BS

Using mathematics to understand the world around us and solve specific problems.
Applied Mathematics Program BS
Using mathematics to understand the world around us and solve specific problems.
Applied Mathematics: Actuarial Science Concentration BS
Prepare for a career as a statistician, data analyst, or actuary with this concentration.
Mathematics: Secondary Education Teacher Licensure Concentration BS

Specialize your mathematics skills by obtaining your teaching certification in secondary education.
Bioengineering Program BS
A flexible, interdisciplinary program encompassing biotechnology, engineering design, physics, mathematics, and computer science.
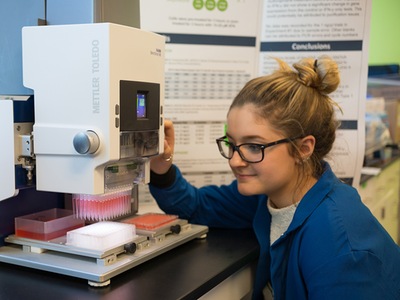
Biology and Biotechnology Program BS
Cutting-edge curriculum builds skills and knowledge in areas like genomics, molecular biology, and bioinformatics.
Biology and Biotechnology Program BS
Cutting-edge curriculum builds skills and knowledge in areas like genomics, molecular biology, and bioinformatics.
Biology and Biotechnology: Secondary Education Teacher Licensure Concentration BS
Becoming a biology teacher means you'll be entering into one of today's most exciting, in-demand careers.
Computer Science Program BS
Curriculum provides a foundation in the contemporary design and implementation of technology and direct engagement with the latest trends.
Criminal Justice Program BS
A comprehensive program covering the American justice system and domestic and global security.
Engineering Program BS
A wide range of core engineering skills, a firm foundation across many disciplines, and a personalized learning experience to prepare you for your future in the field.
English Program

A foundation in literary history, terms, and genres, plus innovative literature, creative writing, and professional writing electives.
English: Creative Writing Concentration BA

Hone your writing skills, examine literary texts, and develop your own voice through a creative writing concentration.
English: Literature and Language Concentration BA
Further your study of English through a concentration in literature and language.
English: Secondary Education Teacher Licensure Concentration BA
Specialize your English skills by obtaining your teaching certification in secondary education.
Environmental Science Program BS

A multi-discipline study of the natural world highlights how human activity, industry, policies, and social trends affect the environment.
Environmental Science: Secondary Education Teacher Licensure Concentration BS
Specialize your environmental science studies by obtaining your teaching certification in secondary education.
History Program BA
Examine events from regional to world history to uncover the root causes of political and social change, and to understand contemporary issues.
History: Secondary Education Teacher Licensure Concentration BA
Specialize your study of history by obtaining your teaching certification in secondary education.
International Studies Program BA
Multi-disciplinary program in politics, literature, art, business, and more, develops leadership skills for a global community.
Liberal Studies Program BA

The most flexible of academic programs allows for the greatest breadth of academic courses from across majors and disciplines.
Liberal Studies Program BA
The most flexible of academic programs allows for the greatest breadth of academic courses from across majors and disciplines.
Liberal Studies Program BA
The most flexible of academic programs allows for the greatest breadth of academic courses from across majors and disciplines.
Liberal Studies: Individually Designed Major BA

An opportunity to pursue your interests in liberal studies that are not available as a specific major.
Political Science Program BS
Develops skills for understanding and navigating complex intercultural factors to help individuals, communities, and nations work together.
Pre-Medical/Pre-Health Professional Program
Prepares you for future studies at competitive graduate, medical, dental, veterinary, and allied health schools.
Psychology Program BS

Wide-ranging topics explore various aspects of human behavior, with clinical, counseling, and research opportunities.
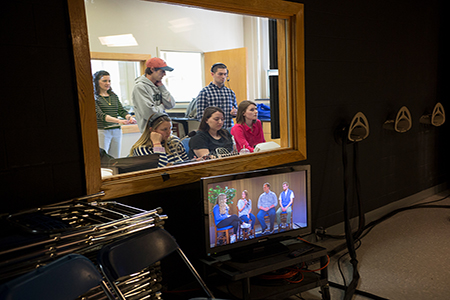
Communication Program BS

Provides a breadth of coursework that engages students in exploring multiple areas of this dynamic field.
Digital Media Program BS

An exciting synergy between filmmaking and journalism including applied production skills. Students choose concentrations in journalism or filmmaking.
Digital Media: Digital Filmmaking Concentration BS

In digital filmmaking, you'll gain a comprehensive understanding of the creative, technical, and business aspects of delivering content across a variety of media platforms.
Digital Media: Digital Journalism Concentration BS
Digital journalism encompasses traditional print-based news, as well as newer media formats like online journalism, social media, podcasts, blogs, and streaming media.
Marketing Communication/Advertising Program BS

Coursework covers all aspects of this complex industry, including advertising, public relations, social media, and integrated marketing.
Marketing Communication/Advertising Program BS
Coursework covers all aspects of this complex industry, including advertising, public relations, social media, and integrated marketing.
Early Childhood Teacher Licensure Concentration BA

Meets regulations for licensure in Massachusetts through either an early childhood or elementary education track.
Early Childhood Teacher Licensure Concentration BA
Meets regulations for licensure in Massachusetts through either an early childhood or elementary education track.
Early Childhood Teacher Licensure Concentration BA
Meets regulations for licensure in Massachusetts through either an early childhood or elementary education track.
Educational Studies Concentration BA

Prepares students for careers in careers in places like day care centers, private schools, museums, and positions that do not require state licensure.
Elementary Teacher Licensure Concentration BA

Meets regulations for licensure in Massachusetts for elementary education (grades 1-6).
Secondary Teacher Licensure Concentration BA

Meets regulations for licensure in Massachusetts, with options for biology, earth science, English, history, math, or visual arts.
Secondary Teacher Licensure Concentration BA
Meets regulations for licensure in Massachusetts, with options for biology, earth science, English, history, math, or visual arts.
Hospitality Management Program BS
A dynamic program that explores the hospitality industry, including marketing, restaurant management, and events management.
Hospitality Management Program BS
A dynamic program that explores the hospitality industry, including marketing, restaurant management, and events management.
Hospitality Management: Events Management Concentration BS
A dynamic program that explores the event planning side of the hospitality industry.
Hospitality Management: International Hospitality Management Concentration BS
The international concentration of hospitality management allows you to explore event planning in the global arena.
Hotel and Resort Management Program BS
Explore the unique industry of hotel and resort management—a mix of business, hospitality, and events management.
Nursing Program BS
Provides theoretical components based on the physical, behavioral, and biological sciences accompanied by practical clinical application.
Art Therapy Program BFA
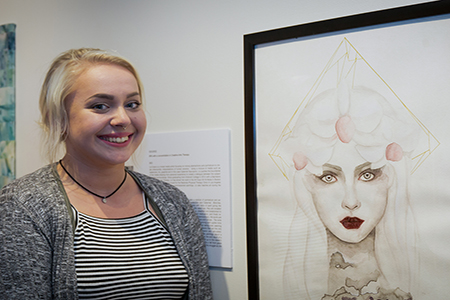
A pre-professional degree integrating studio art, psychology, and creative arts therapy.
Graphic Design Program BFA

A four-year program for practice in the field of graphic design, including interactive, print, web, branding, animation, and motion graphics media.
Interior Design Program BFA

Humanizing interior spaces for aesthetics, codes, function, and form through the design of interior architectural environments.
Photography Program BFA

A four-year program with an emphasis on art practice and exploration, as well as the development of imagery and skills for commercial applications.
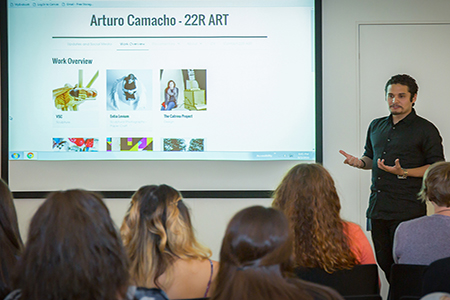
Studio Art Program BFA

Explore all that the arts have to offer through the multi-disciplinary studio art program.
Studio Art: 2-D Concentration BFA
The 2-D concentration in studio art focuses on both traditional and contemporary practices in illustration, painting, and printmaking.
Studio Art: 3-D Concentration BFA
The 3-D concentration in studio art focuses on a combination of traditional processes and contemporary practices.
Studio Art: Art Education Teacher Licensure Concentration BFA
The Art Education Licensure concentration provides an opportunity for studio art majors to obtain teacher licensure in Massachusetts.
Studio Art: Intermedia: Digital Media and Mixed Media Concentration BFA
Allows students to gain skills in various media while developing a unique voice as an artist.
Athletic Training Program BS

Incorporates practical experience with an intensive curriculum containing the necessary competencies established by the National Athletic Trainers' Association (NATA) Education Council.
Coaching Certification Program Certificate

Open to all students who wish to become certified in coaching by the School of Sport Science and Fitness Studies.
Exercise Science Program BS

Gain preparation for careers in fields such as fitness, recreation, hospital or corporate wellness, or strength and conditioning.
Sport Management Program BS

Prepares students with the academic coursework and leadership skills needed for successful careers in the dynamic and competitive sport industry.
Applied Behavior Analysis Fifth Year Program (M.Ed.)
Pursue your master's degree in an accelerated format and complete both the educational and experiential requirements to sit for the Board Certified Behavior Analyst (BCBA) examination.
Autism and Applied Behavior Analysis Fifth Year Program (M.Ed.)
Pursue a dual focused program of study that will enable you to take a variety of courses in both autism and applied behavior analysis (ABA).
Education Fifth Year Program (M.Ed.)
Complete your master's degree and become a licensed educator—in one year.
Homeland Security Studies Fifth Year Program (M.S.)
Gain an advantage in fast-growing career areas such as emergency management, cybersecurity, and transportation security within the federal, state, local, and private levels.
Interior Architecture Fifth Year Program (M.A.)
Gain expertise in design research, analysis and design of complex interior environments, and you will be prepared for careers in commercial, institutional, healthcare, residential, and sustainable design.
Master of Business Administration Fifth Year Program (MBA)
Gain a competitive advantage in your career through intensive, advanced study in business disciplines.
Nursing Fifth Year Program (M.S.)
Allows graduates in nursing to move into the master's degree program in nursing education or nursing administration.